Reports
Tier 3: Practice Management accounts on Embodia allow you to view and track a wide range of reports to assess the health of your clinic.
The actions described in this lesson require a Manager permission in your clinic.
You can access the Reports clicking on the Settings tab in the top nav bar, and then on Reports under the Stats, reports & exports section.
You can see the following reports on Embodia, and each one is outlined in greater detail below:
For all the reports, you can filter by date and/or practitioners, as well as additional options for some reports:

Accounts receivable
This report is an accounts receivable aging report that groups unpaid patient invoices by how long they have been outstanding (1-30 days, 31-60 days, 61-90 days, or 91+ days). First, select your filters including the start and end dates for the report you would like. You can also filter by practitioner, compare with another time period (for example compare the current month with the last month), and include payments received on invoice date:
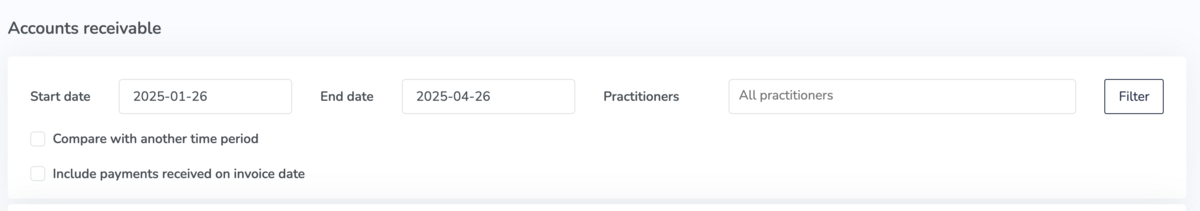
You will then see a summary of the report, breakdown per payment method, and the ability view a breakdown per patient:

Booked appointments
First, select your filters for your booked appointments. Filters include the start and end dates for the report, the practitioner, and you can choose to compare with another time period (for example compare the current month with the last month):

Total appointments and cancelled appointments are displayed, as well as the number of booked appointments per category and service, in table and pie chart forms. The colours displayed are those you selected for your clinic's categories and services. Setting up your services is outlined in the help article, Setting up your services.
The outer slices on the pie graph indicate the category (#1 in the image below) and the inner slices represent services (#2 in the image below). Hovering over an area in the pie graph will display what that section represents (#3 in the image below).

Clients who haven't rebooked
Choose your filter settings and check the box beside Include patients who have been discharged if you would like to include them in your report. You will then see a list of clients/patients who have not rebooked.
Clicking on the hyperlinked patient name will take you to their profile.

Clinical cases stats
After choosing your date range, practitioner name, and assessments and/or follow-ups you would like to filter for, you will see the total, ongoing, and completed number of clinical cases.
To learn more about clinical cases on Embodia, take a look at our help article Clinical cases on Embodia.
You will see a table listing all clinic practitioners and the total number of clinical cases they have, how many of those are ongoing, how many have been completed, and the number of successful and self-discharges.
You will also see two graphs:
- Clinical case stats by practitioner: displays successful discharges, self-discharges, and ongoing cases.
- Follow-ups / Assessment: displays the number of follow-ups booked per assessment in a clinical case.

Packages stats
Packages stats include all the revenue collected and revenue not yet collected, and the remaining amount from packages and memberships.
Three figures will be generated for revenue reporting:
- Total revenue, collected, and remaining amount;
- Revenue per clinic package;
- Revenue per practitioner.


Patient charts stats
Displays the total number of charts, signed charts, unsigned charts, and uncharted consults for each practitioner in the clinic.

Clicking on a hyperlinked number from the table will allow you to see all the charts in that category for a given practitioner. Click on a hyperlinked chart from the generated list to navigate to it. For example, when we click on Uncharted for Elie Afif, we are brought to this page: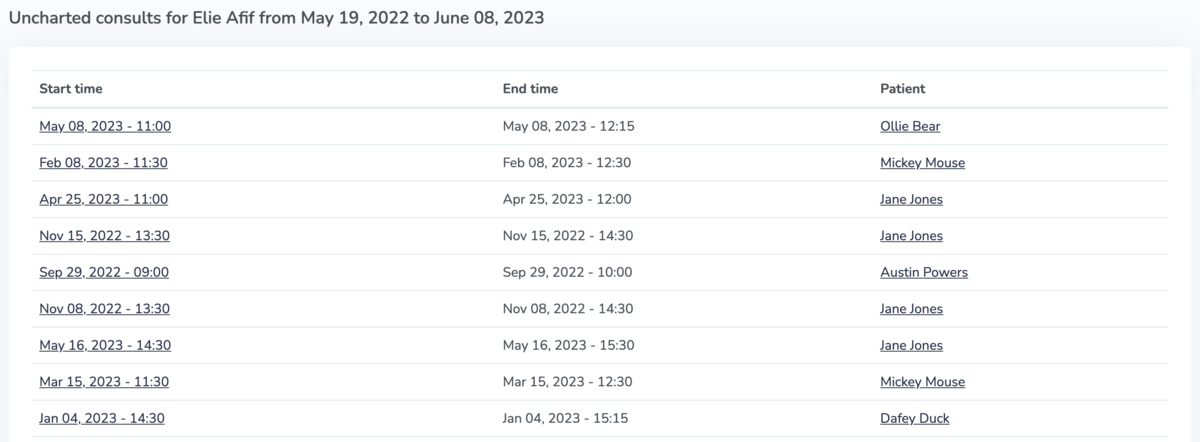
Patient stats
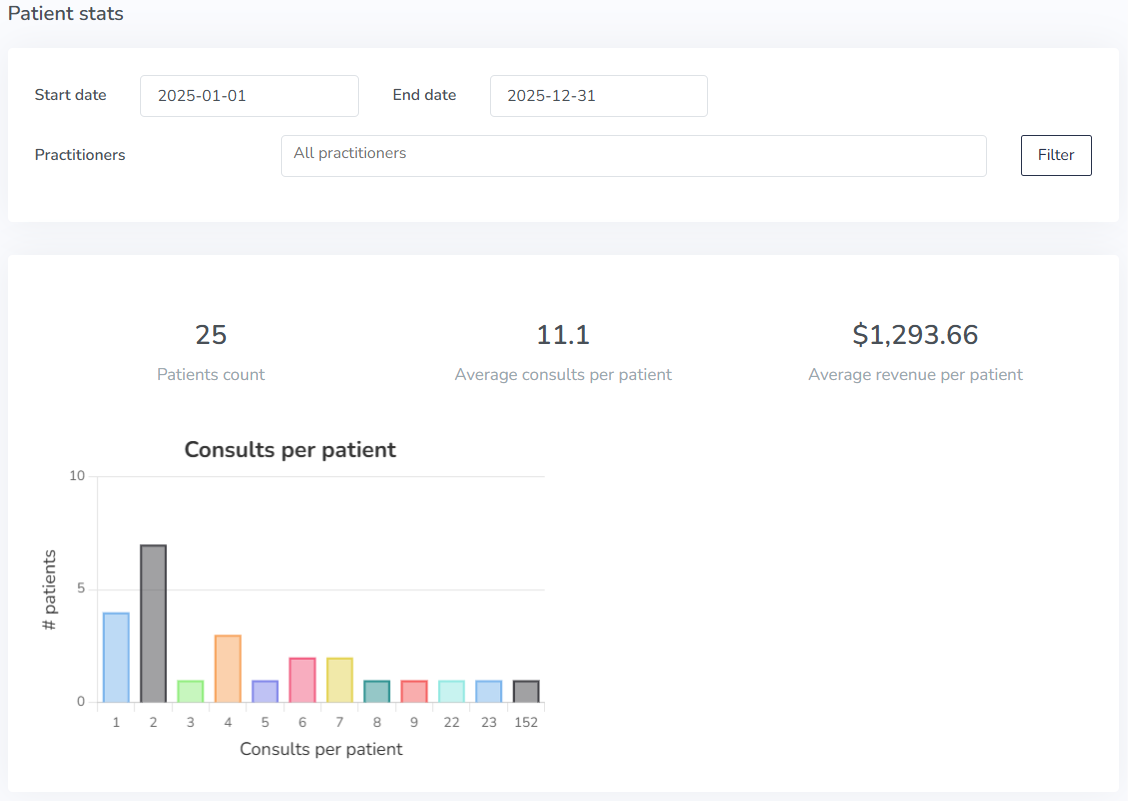
The patient stats report will include the following:
- Number of patients who had at least one consult scheduled during the specified time range
- The average number of consults per patient during the specified time range, as well as a chart with the distribution of number of consults per patient
- The average revenue per patient during the specified time range
Patient properties
Patient properties are used to collect important information that doesn’t change frequently. For example the patients’ phone number, physician’s name/phone number, referral source, etc. You can learn more about patient properties in our help article, Using patient properties.
Patient properties stats will display bar graphs for patient properties. Reports can be set up from any patient property of the type 'Radio button' and/or 'Drop-down', once you have created the patient property for your clinic.
In addition, filtering by practitioner will show the patient properties for their patients only.
To learn more about these types of patient properties that can be used to generate reports, visit the help article, Using patient properties.

Payment methods stats
View patient invoice payments sorted by payment method and what amount is paid or not paid. Hovering over a category in the table will tell what dollar amount is paid or not paid.

Revenue
Revenue reports include all the patient invoices revenue collected and revenue not yet collected (accounts receivable).
Four figures will be generated for revenue reporting:
- Total revenue;
- Revenue per service;
- Revenue per product (relevant if your clinic sells products);
- Revenue per practitioner.


Utilization rate
Displays each practitioner's total available time and booked time. The available time is based on the availability they have set up. Learn more about setting up availability in this help article. Each practitioner's utilization rate is then calculated as a percentage of Booked time/Available time.
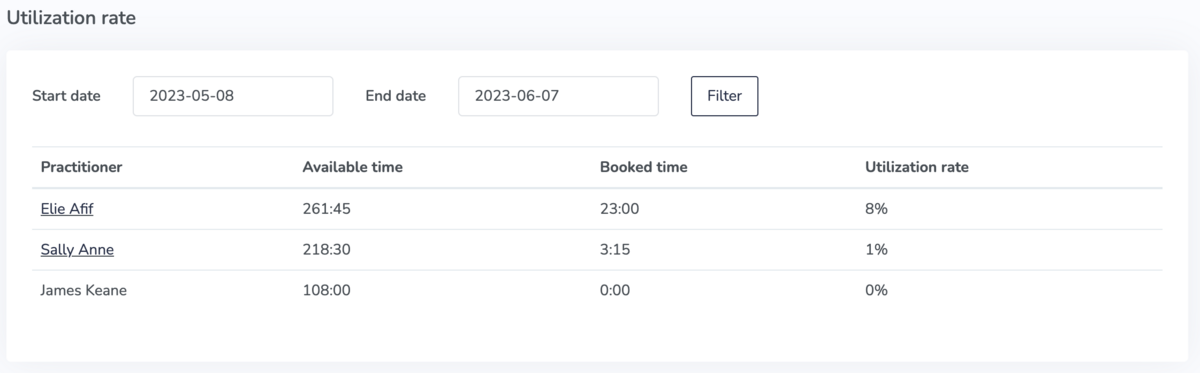
Clicking on the hyperlinked practitioner name displays the practitioner's utilization rate, available time and booked time in minutes per selected date interval.
